November 3, 2015
Programmatically visualizing fall
For the Whenology project, I needed to visually describe key concepts related to leaf color change during Fall. The obvious answer was to simply draw some trees! But how?
I knew that D3js could import SVG files, so the first step was to draw a tree. I started with a public domain picture of a leaf and used Adobe Illustrator’s Image Trace feature to turn it into an SVG outline.

I also used Illustrator to draw a tree trunk with branches,

Over this, I copied-and-pasted the leaf outline many times to create a tree with full foliage and saved the image as an SVG.
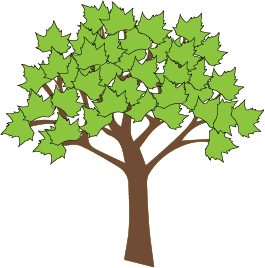
At this point, I could use D3js to render this exact tree on a webpage. That was nice, but what I really needed was a way to draw trees with different amounts of leaves and degrees of brownness. The brute force approach would have been to draw different trees in Illustrator but that seemed “inelegant”. What I really wanted to do was modify the tree SVG dynamically with D3js.
This turned out to be pretty easy to do. The essential trick was to edit the tree SVG file and add a class attribute to each leaf path. Basically, change this
    ...
    <path fill="#8CC63F" stroke="#000000" ...../>
    <path fill="#8CC63F" stroke="#000000" ...../>
    <path fill="#8CC63F" stroke="#000000" ...../>
    <path fill="#8CC63F" stroke="#000000" ...../>
    ...
to this,
    ...
    <path class="leaf" fill="#8CC63F" stroke="#000000" ...../>
    <path class="leaf" fill="#8CC63F" stroke="#000000" ...../>
    <path class="leaf" fill="#8CC63F" stroke="#000000" ...../>
    <path class="leaf" fill="#8CC63F" stroke="#000000" ...../>
    ...
With that small change, the color and number of leaves can be changed interactively using D3js. To see this in action, play around with the sliders in this visualization,
This approach isn’t limited to visualizing one tree, a whole forest can be made by repeatedly cloning the SVG object. This was exactly what I wanted. I was really happy with the visualizations I created using this approach.
Below is example D3js and JavaScript code for loading, rendering, and interactively updating the tree. This gist shows how I created the sliders based on Mike Bostock’s example.
    var leafColor = d3.scale.quantize()
          .domain([0,1])
          .range([d3.rgb("#8da43b"),d3.rgb("#5c5b32"),d3.rgb("#814725")]);

    function drawTree(x, y, pBrown, pMissing, scale) {

      var treeG = svg.append("g")
            .attr("class","tree")
            .attr("transform", "translate(" + (x-(treeWidth/2)*scale) +
                  "," +
                  (y-treeHeight*scale) + ")scale(" + scale + ")")
            .each(function (d,i) {
              this.appendChild(treeNode.cloneNode(true));
            });

      treeG.selectAll(".leaf")
        .style("fill", function(d) {
          return leafColor(pBrown + Math.random()) ;})   //<= pbrown ? "brown" : "green"; })
        .style("opacity", function(d) {
          return Math.random() <= pMissing ? 0 : 1;
        });
    }

    function update(pBrown, pMissing) {
      svg.select(".tree")
        .selectAll(".leaf")
        .transition()
        .style("fill", function(d) {
          return leafColor(pBrown + Math.random()) ;})
        .style("opacity", function(d) {
          return Math.random() <= pMissing ? 0 : 1;
        });
    }

    var svg, width, treeNode, treeHeight, treeWidth;
    d3.xml("/data/tree.svg", function (e, svgTree) {

      var margin = {top: 20, right: 40, bottom: 20, left: 40},
         width   = 600 - margin.left - margin.right,
         height  = 350 - margin.top - margin.bottom;

      svg = d3.select("#viz").append("svg")
        .attr("height", height + margin.top + margin.bottom)
        .attr("width", width + margin.left + margin.right)
        .append("g")
        .attr("transform", "translate(" + margin.left + "," + margin.top + ")");

      treeNode   = document.importNode(svgTree.documentElement, true);
      treeHeight = parseFloat(treeNode.getAttribute("height"));
      treeWidth  = parseFloat(treeNode.getAttribute("width"));
      treeX      = width-treeWidth/2;
      treeY      = treeHeight;

      var pBrown   = -1; // Range -1 to 1 to force all green or brown
                         // regardles of random number
      var pMissing = 0;  // Range 0 to 1
      var pScale   = 1;

      drawTree(treeX, treeY, pBrown, pMissing, pScale);
    }
Tags: D3js , Visualization , SocialGood