Identifying Key Members of a Collaboration Network
One of my first data science efforts was an analysis of the collaboration network from the innovation contest held each year by my employer. For my CS224W Social and Information Networks Analysis class project, I decided to take another look at this network. Specifically, I wanted to test the hypothesis that lead innovators occupied structurally significant locations in the network and were discoverable using centrality measures.
This time, I aggregated the data from the 2010, 2011, and 2012 contests to construct a much larger network. I confirmed that the network had attributes similar to the scale-free, small-world collaboration networks examined in the relevant literature - a giant component, short average path length versus network diameter, high clustering coefficient, and a power-law degree distribution.
I then calculated the following centrality measures for each node,
- Degree
- Closeness
- Betweenness
- Weighted Degree, Closeness, and Betweenness
- PageRank
- Weighed PageRank
- Entropy Sensitivity
- Cummulative Nominations
- Group Centrality
For each measure, I ranked the nodes and calculated precision and recall metrics based on where the known contest finalists and winners appeared in the orderings. The results were mixed. Generally speaking, each centrality measure ranked some finalists and winners highly but the remainder were ranked over a wide range.
I offerred two possible explanations for the poor precision and recall results,
- Not all finalists and winners may have been lead innovators, especially in the case of large teams.
- Not all lead innovators may have placed in the contests due to limited selection, and subjective factors.
Based on these possible explanations, I performed k-means on the centrality measures to see if lead innovators got collected into clusters. The results were more encouraging. The final k-means model produced multiple small clusters with a disproportionate amount of known finalists and winners. In addition, these clusters had centroids based on multiple centrality scores. This provided evidence that lead innovators may occupy structurally significant positions in the network.
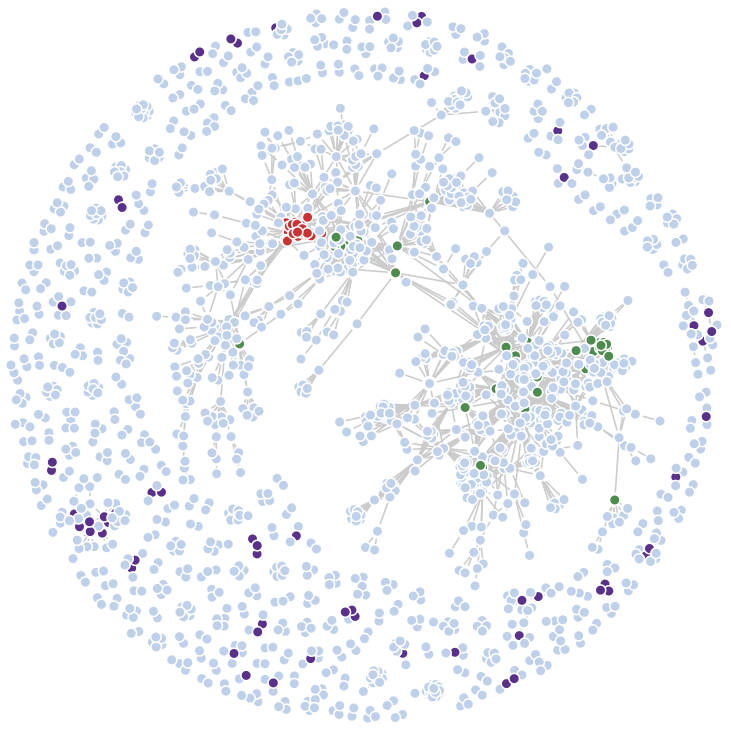
As a visual check, I plotted the collaboration network graph with the nodes identified by the k-means model,
and compared it to the same network with the set of nodes ranked in the top twenty across all of the centrality measures considered.
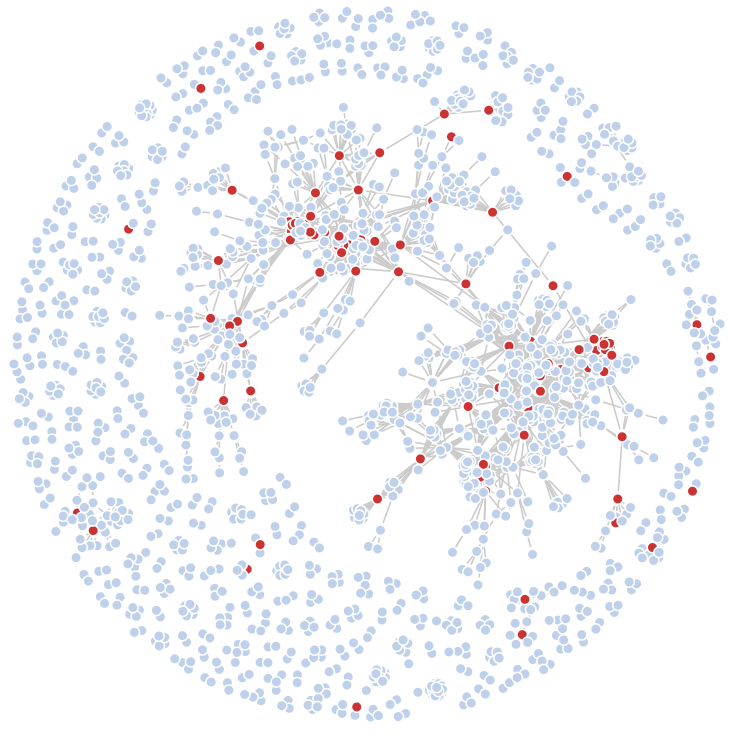
The k-means approach clearly identified different nodes than those identified by just ranking. In particular, k-means identified more participants outside the giant component who may be emerging lead innovators.
The results from this analysis were promising but perhaps not conclusive. It’s an interesting topic that I might return to one day. If interested, this report documents the details of this project.