January 29, 2015
Skewing Around, Part 3
In parts 1 and 2 , I described how I used the AMS and HyperLogLog online algorithms to estimate the frequency distribution of values in multiple integer sequences. I was doing this for a friend that needed a compute and space efficient way to analyze thousands of such streams.
Although the solution I came up with in Part 2 worked, it didn’t express the “skew” in human understandable terms like “20% of the values accounted for 80% of the occurrences”. Challenge accepted.
In the last post, I explained that an integer stream of length \(O\) with an equal number of occurrences of \(N\) values will have a minimum surprise number of,
And that this can be combined with the estimated surprise number to create a scaled “skew” metric \(R\) that is comparable between different streams,
The resulting \(R\) metric will be,
Expressing this in terms of the estimated ratio described in the last post leads to,
Now, lets substitute \(R\) with a new metric \(R^{\prime} = \tilde{R} - 1\),
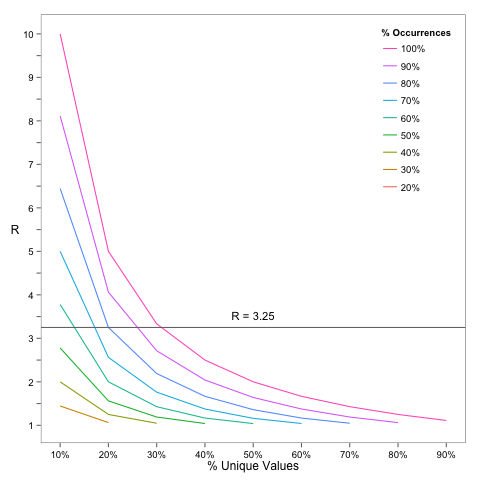
Since this equation has two unknowns, there are many solutions of \(p\) and \(q\) for a given \(R^{\prime}\). For example, \(\tilde{R} = 3.25\) has an infinite number of possible solutions including: \({p=.9, q=.25},{p=.8, q=.2}, {p=.6,q=.15}\). The following figure illustrates this,

However, as the figure suggests, an upper bound on \(q\) can be found by setting \(p <= 1\).
Recalling the definition of \(R^{\prime}\),
This means that the upper bound on the percentage of skewed values is the reciprocal of the estimated \(R\). Cool!
Unfortunately, with both \(p\) and \(q\) unknown and only one equation, this was as far as I could take this. However, the upper bound and family of curves for given values of \(p\) were enough for my friend to do what he wanted.
This was a fun project. I got to see first hand that although probabilistic online algorithms sacrifice accuracy for efficiency, they can still perform well enough to get the job done!
Tags: MachineLearning , Streams