Analysis of an Innovation Contest Collaboration Network
Each year, my employer holds an innovation contest that invites employees to submit, individually or in teams, ideas for new products, features, and processes. The 2011 event coincided with my foray into data science so I volunteered to analyze the data from the contest.
After generating the standard statistics and charts, I was inspired by the book Linked and Drew Conway’s SNA in R talk to analyze the contest’s collaboration network. This had never been done before and I was curious to see what it would reveal.
I started off by creating the following force directed graph of the collaborative network using R and the igraph package.
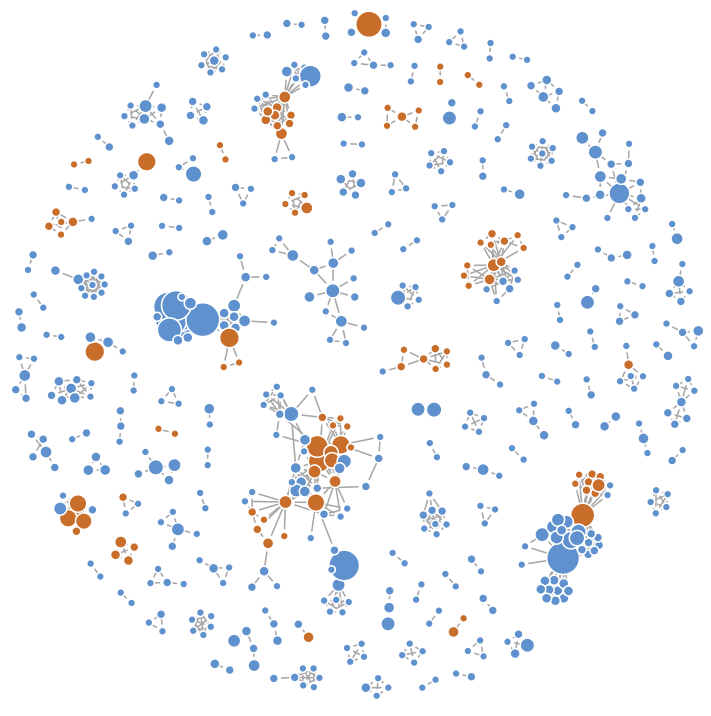
Each circle in the graph represents a single contest participant. The area of each circle is proportional to the participant’s number of entries in the contest. Orange circles represent contest finalists and winners. An edge between two circles means that the corresponding participants collaborated on at least on entry.
The insights from this graph were surprising. Groups of collaborators were clearly visible. It was also apparent that many finalists and winners occupied key locations in the network. This graph confirmed, for the first time, that the contest was giving rise to a network of innovators.
Encouraged, I tried to identify network “hubs” using a weighted linear combination of each participant’s number of entries, number of connections (degree centrality), and betweenness centrality. The approach was surprisingly effective. Many know lead innovators were highly ranked. More importantly, a handful of previously unknown innovators were also highly ranked. These employees were subsequently integrated into existing innovation forums and talent management processes to increase their influence and support their growth.
As a final exercise, I took a closer look at the five largest connected components.
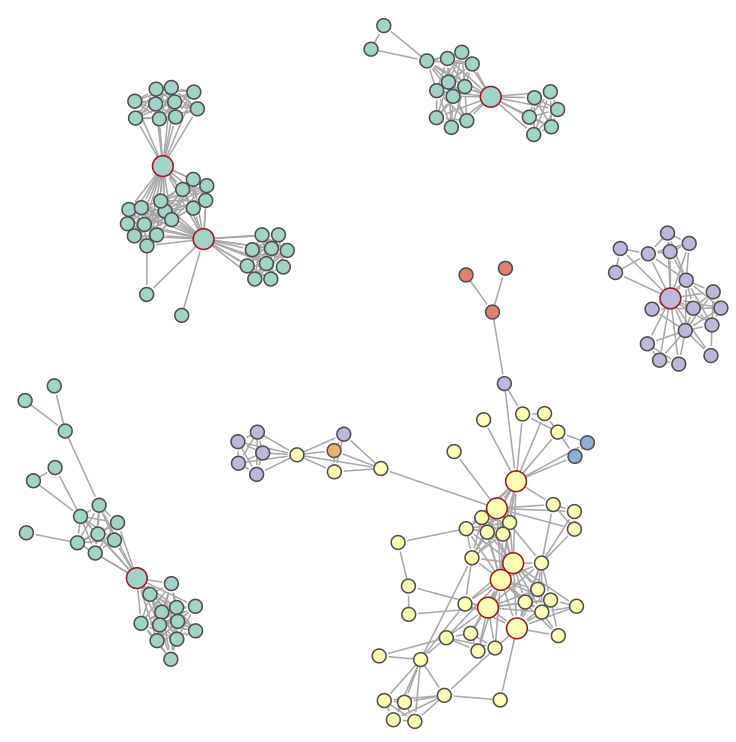
Three of the components were from the same geographic region. We were surprised to find out that the hubs of these components were employees specifically trained to help others develop their innovation ideas and contest submissions. The analysis appeared to validate that region’s innovation best practices. This motivated an effort to promote the same practices in other locations.
This analysis of the innovation contest’s collaboration network surpassed my expectations. With it I was able to confirm the presence of a innovator network, reveal previously unknown lead innovators, and identify effective innovation best practices. The findings have had a lasting effect on the innovation contest and community. And all this from just a couple of afternoons of R coding. Not bad.
Since I didn’t have a blog at the time, a colleague of mine, Steve Todd, documented the results in a series of posts on his site 1 2 3 4 5 6 7.
Be sure to read the follow up analysis that I did for my CS224W Social and Information Networks Analysis class project.